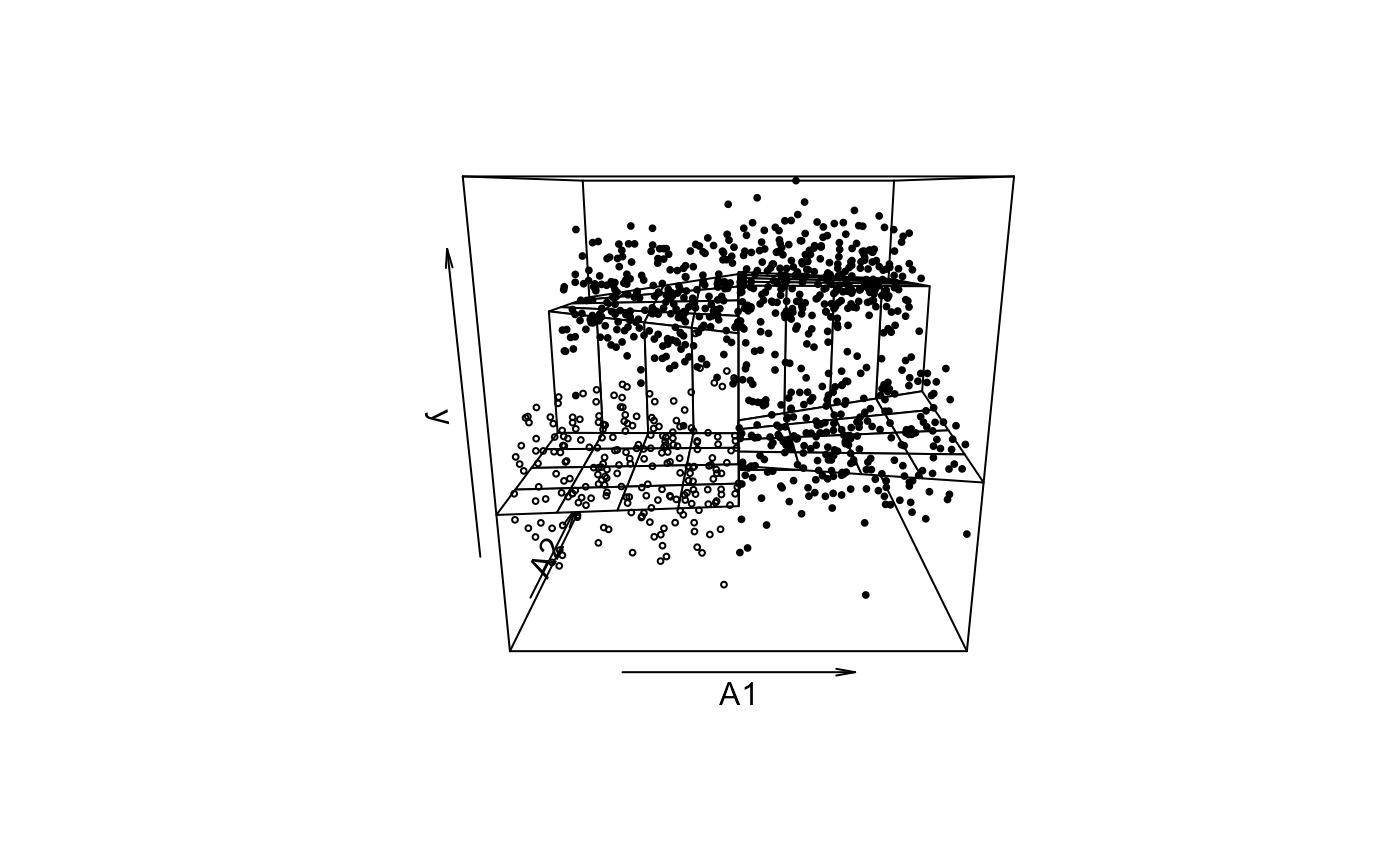
Plot the Multivariate Frontier Regression Discontinuity
plot.mfrd.Rdplot.mfrd plots a 3D illustration of the bivariate frontier regression discontinuity design (RDD).
Arguments
- x
An
mfrdobject returned bymfrd_estor contained in the object returned bymrd_est.- model
A string containing the model specification. Options include one of
c("m_s", "m_h", "m_t"), which denote the complete model, heterogeneous treatment model, and treatment only model, respectively.- methodname
A string containing the method specification. Options include one of
c("Param", "bw", "Half-bw", "Double-bw").- gran
A non-negative integer specifying the granularity of the surface grid (i.e. the desired number of predicted points before and after the cutoff, along each assignment variable). The default is 10.
- raw_data
A logical value indicating whether the raw data points are plotted. The default is
TRUE.- color_surface
A logical value indicating whether the treated surface is colored. The default is
FALSE.- ...
Additional graphic arguments passed to
persp.